

Interface
Microsoft Power BI + Solytic
Optimized Reporting: Leverage data from Solytic Monitoring Software for your customized Microsoft Power BI reports.

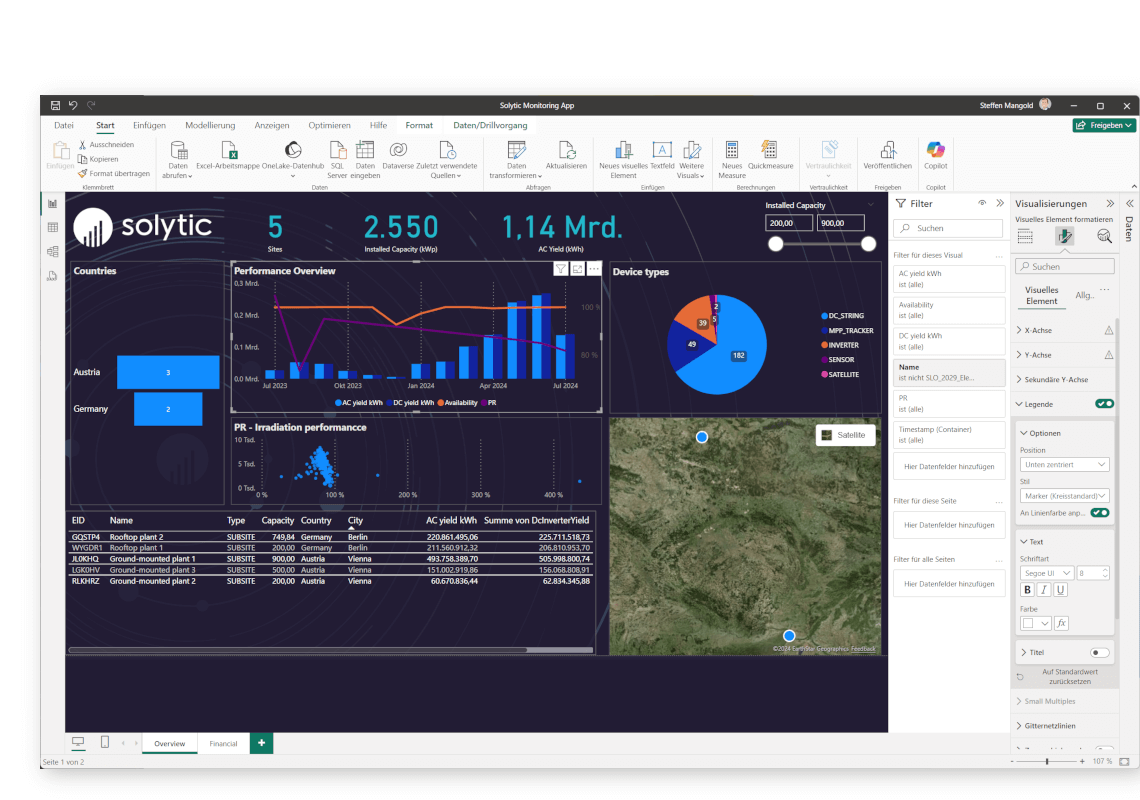
Custom dashboards
Create customized dashboards for different recipient groups such as investors, owners, or operators of PV plants. Determine the level of detail and information yourself, and integrate important intranet information for management if needed. The dashboards are interactive and offer customized data visualization.
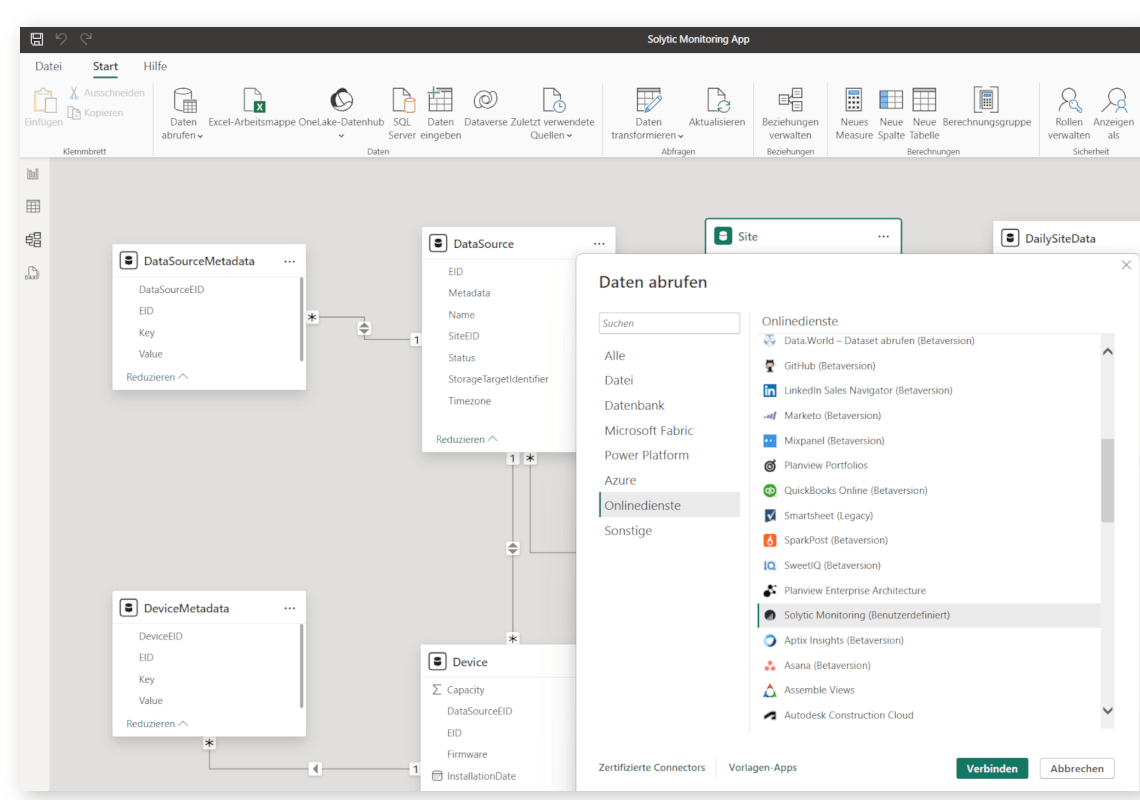
Linking with external data
Connect Microsoft Power BI to external data sources such as market data or financial figures to expand your dashboards. Supplement with internal process information and integrate data from sales and service for a comprehensive analysis.
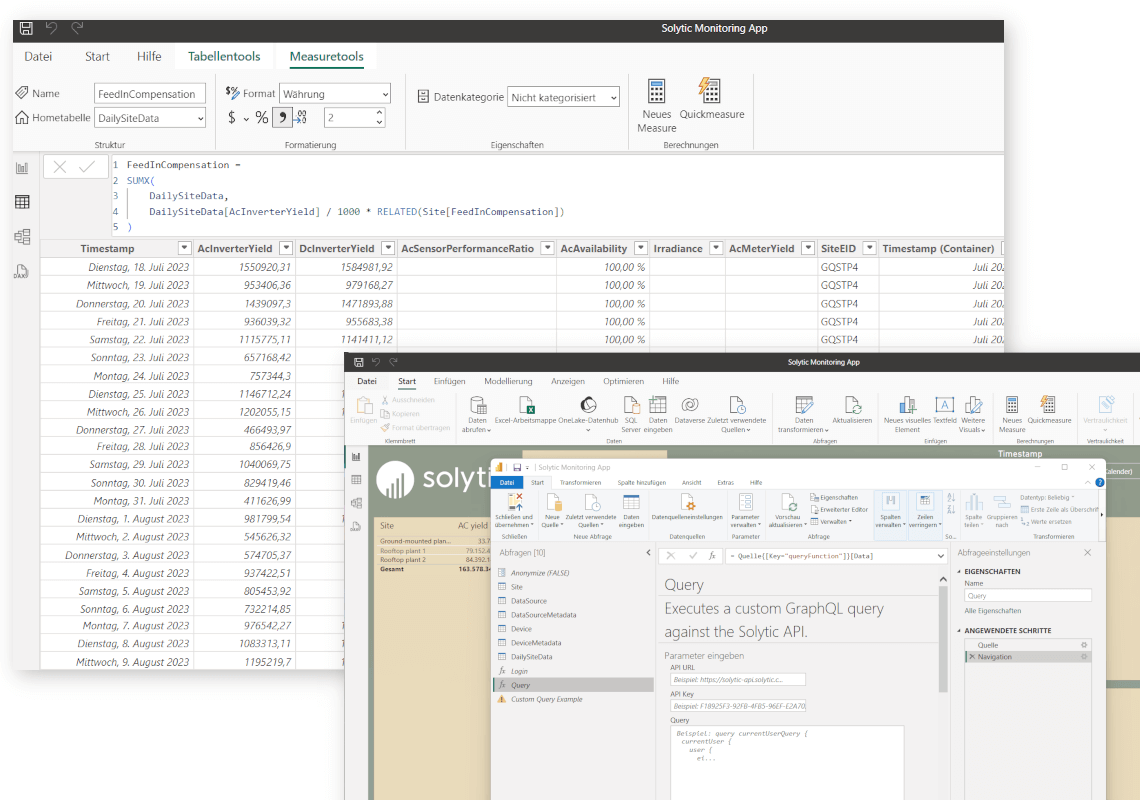
Creating custom formulas and metrics
Develop custom formulas for metrics such as Performance Ratio or availability and set benchmarks for different regions or clients. Incorporate external factors for a more precise, tailored analysis.
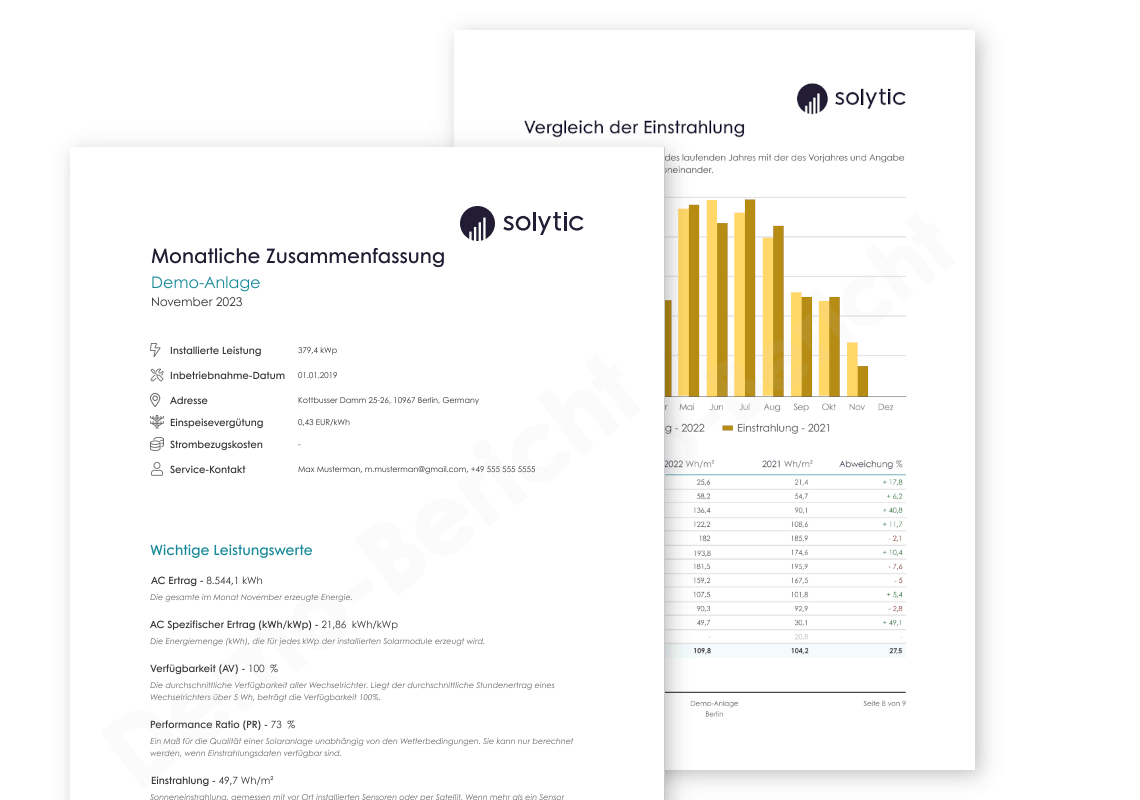
Create custom reports
Leverage Power BI’s data storage to create custom PDF reports tailored specifically to your various clients. You have full control over the layout and design of the reports and can enhance them with your own information to produce highly personalized reports.
Do you have questions about our Microsoft Power BI integration?
Feel free to get in touch with us and receive advice from one of our product experts.
Get in touch
FAQs
Here you will find the most frequently asked questions and answers about our Power BI connector
What do I need to use the monitoring connector?

